

Build a dashboard view
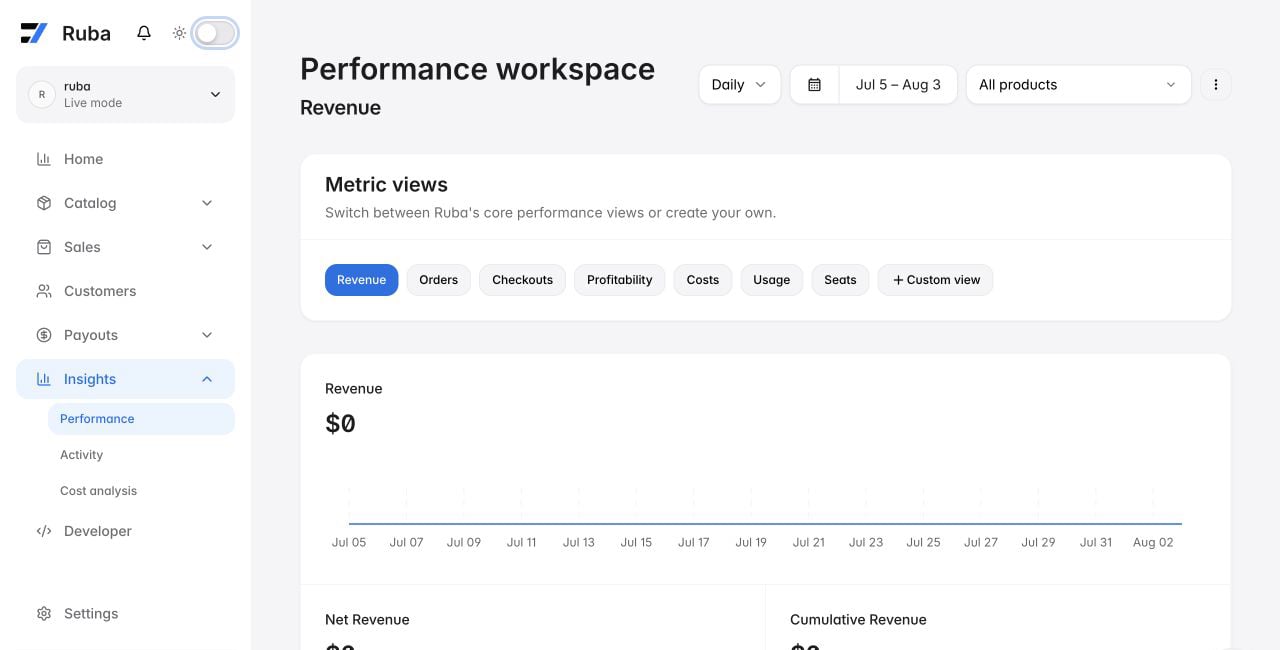
Open Insights → Performance to switch among Ruba’s built-in metric views. Subscriptions and Cancellations appear after the organization has a recurring product, while Seats appears when seat-based billing is enabled. Select Custom view to name a dashboard and combine up to ten metrics. A custom view can later be edited, exported, or deleted from its actions menu. Built-in views can also be exported.How metrics are grouped
The selected range is divided into equal intervals of one hour, day, week, month, or year. Each interval becomes one chart point and one item in the API response.Subscriptions
Cancellations
Canceled Subscriptions counts the decision timestamp; Churned Subscriptions counts the later moment the paid period ends. Churn Rate divides churned subscriptions by the active base at the beginning of the interval. The dashboard repeats Active and Committed Subscriptions beside churn for context and groups cancellation reasons intotoo_expensive, missing_features, switched_service, unused, customer_service, low_quality, too_complex, and other.
One-Time Products
One-Time Products counts completed non-recurring orders. One-Time Products Revenue adds their gross subtotals before fees.Orders
Checkouts
Checkouts counts every created session. Succeeded Checkouts counts sessions that produced an order. Checkout Conversion divides succeeded by created and returns zero when no sessions exist.Net Revenue
Net Revenue removes platform and processor fees from order revenue. Net AOV divides that result by orders; Net Cumulative Revenue carries it forward across intervals. Separate new-subscription, renewal, and one-time net metrics appear when the matching revenue model exists.Costs
Cost Insights supplies this dashboard through events containing_cost.